library(denguedatahub)
library(tsibble)
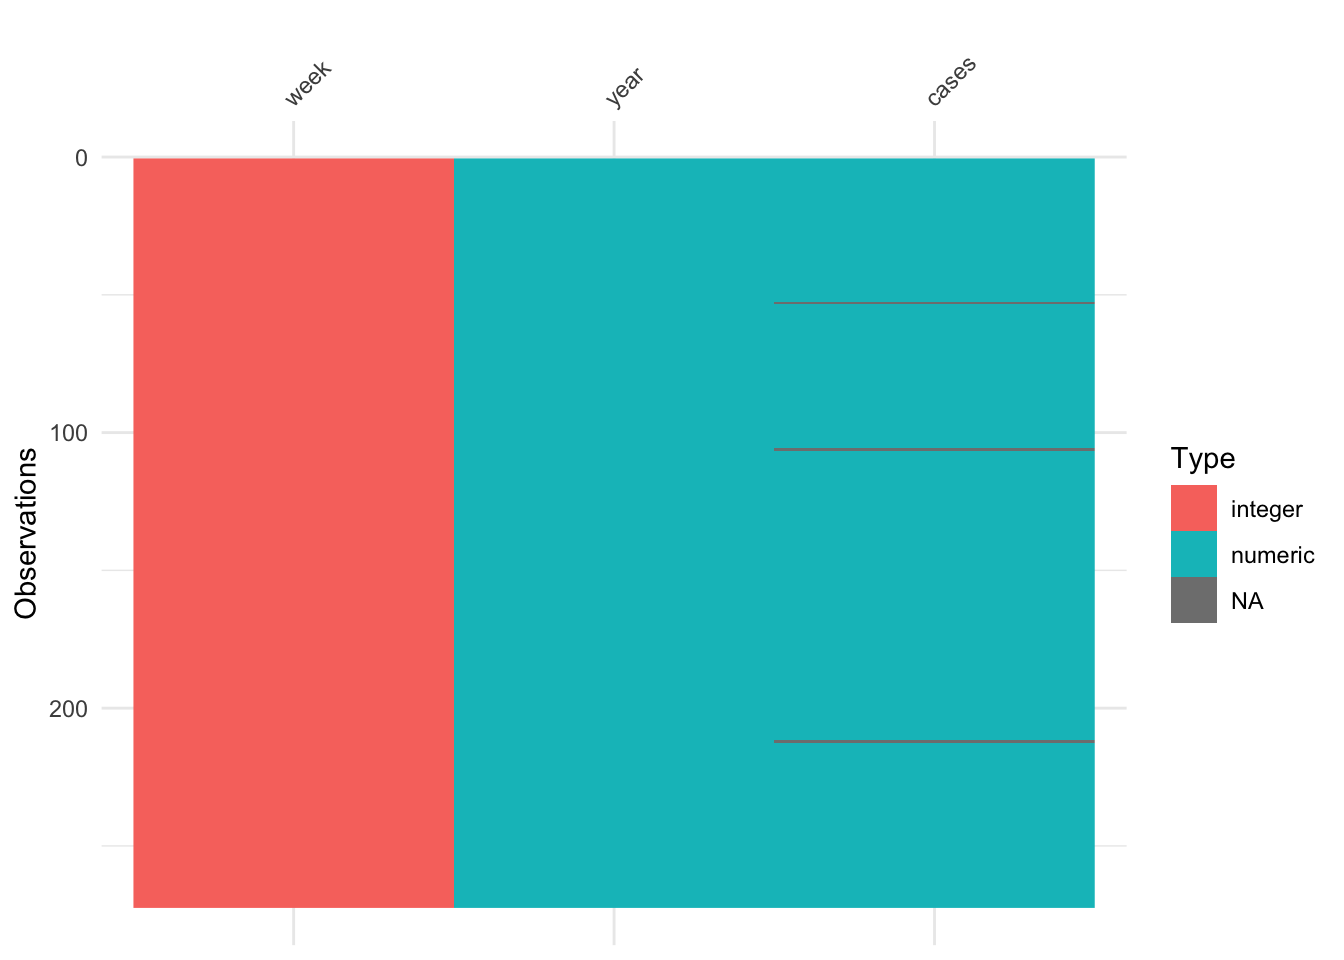
singapore_weekly_data# A tibble: 272 × 3
year week cases
<dbl> <int> <dbl>
1 2018 0 54
2 2018 1 45
3 2018 2 48
4 2018 3 50
5 2018 4 50
6 2018 5 28
7 2018 6 30
8 2018 7 37
9 2018 8 51
10 2018 9 37
# ℹ 262 more rows