library(denguedatahub)
library(tsibble)
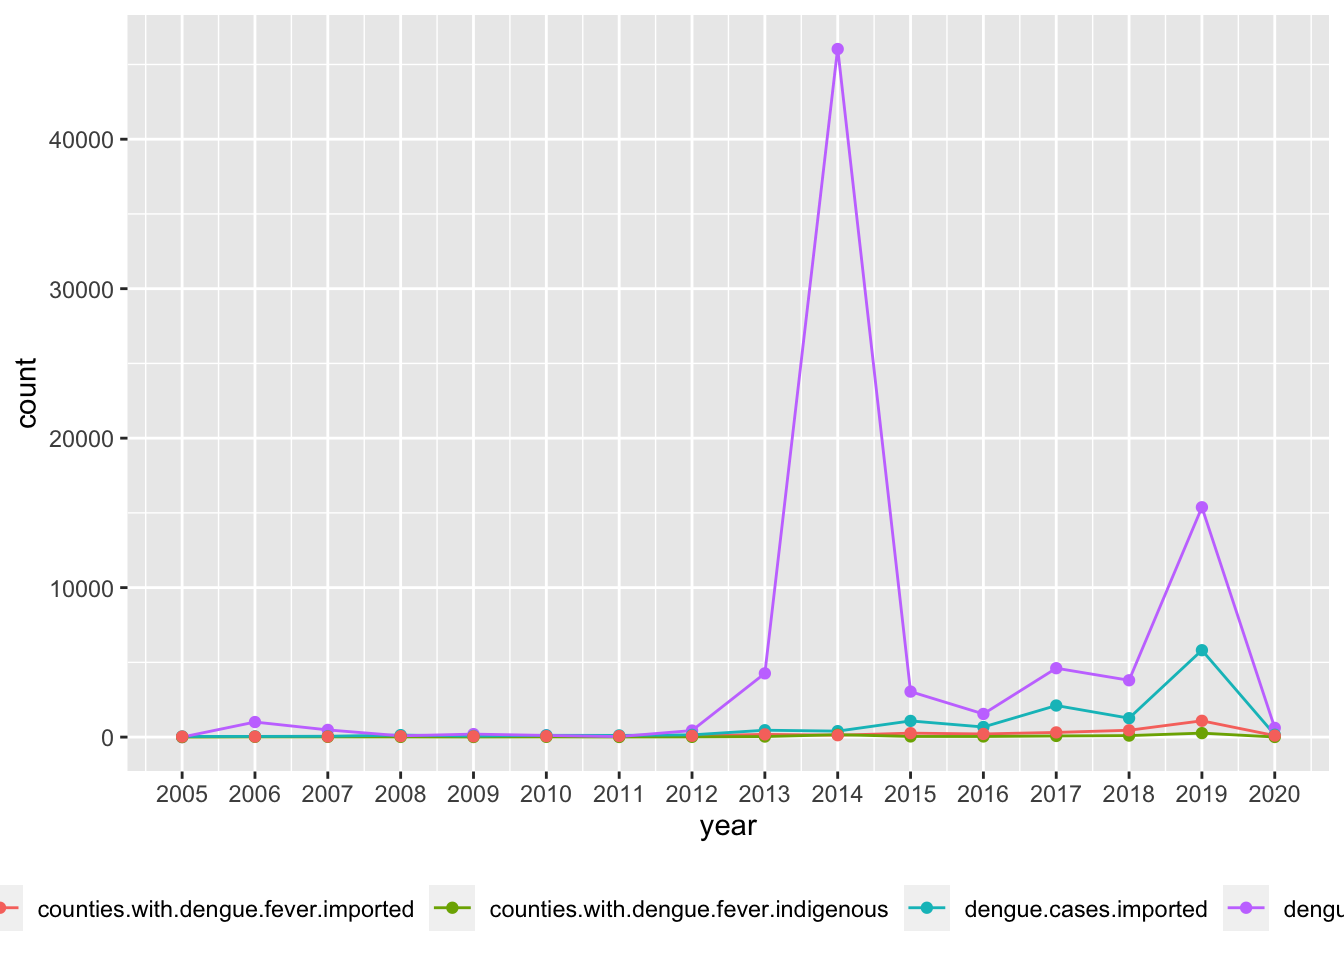
china_annual_data# A tibble: 16 × 5
year dengue.cases.indigenous dengue.cases.imported counties.with.dengue.fe…¹
<int> <dbl> <dbl> <dbl>
1 2005 0 45 0
2 2006 1007 46 15
3 2007 481 56 13
4 2008 86 134 11
5 2009 200 73 5
6 2010 112 119 14
7 2011 35 113 6
8 2012 438 149 14
9 2013 4263 460 36
10 2014 46034 399 160
11 2015 3044 1083 44
12 2016 1549 675 41
13 2017 4609 2112 76
14 2018 3801 1266 100
15 2019 15378 5813 266
16 2020 616 158 7
# ℹ abbreviated name: ¹counties.with.dengue.fever.indigenous
# ℹ 1 more variable: counties.with.dengue.fever.imported <dbl>