library(denguedatahub)
library(tsibble)
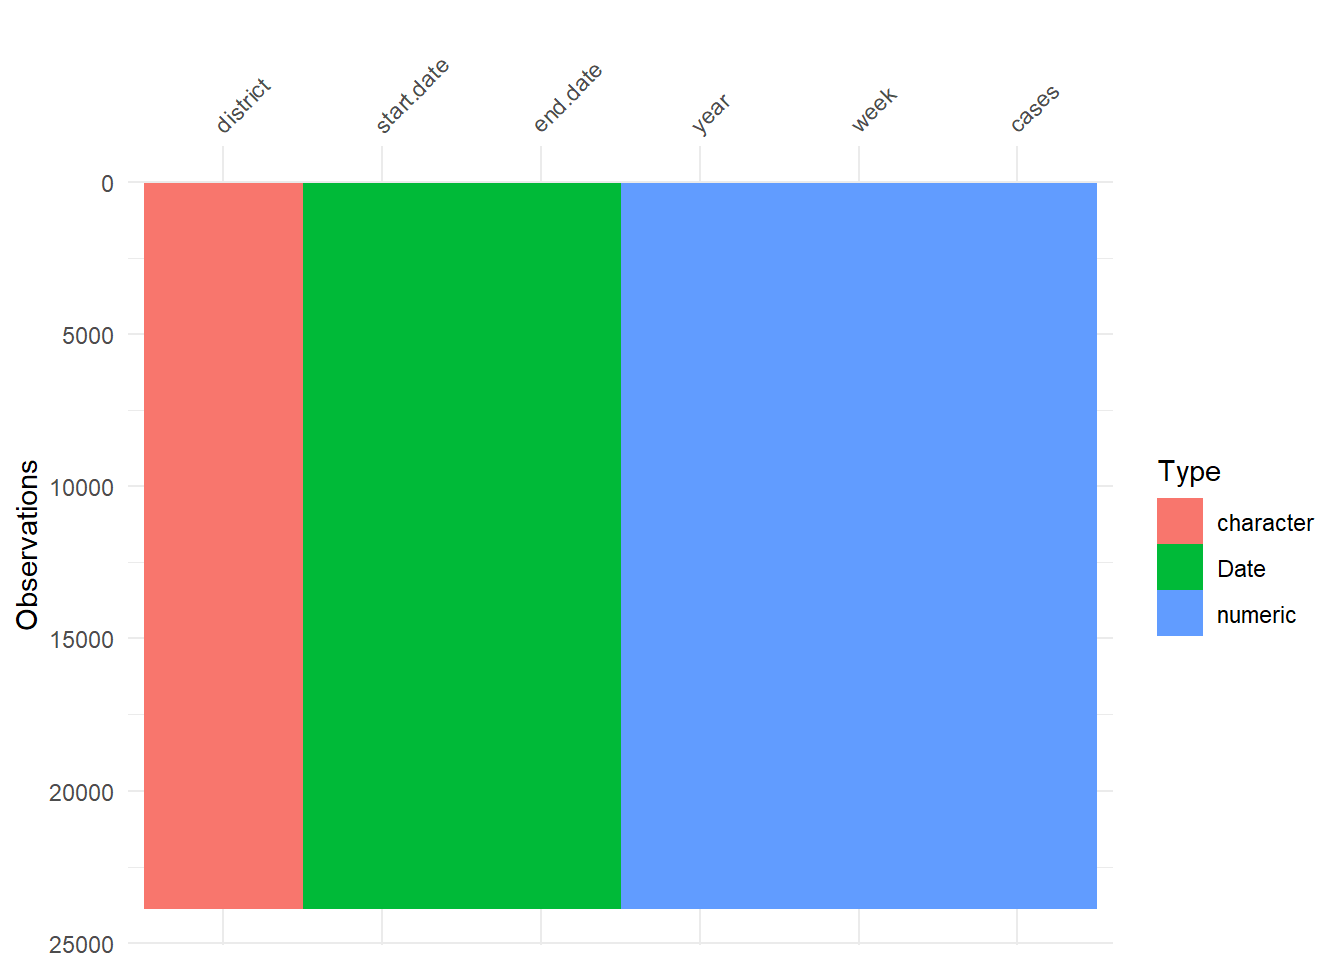
srilanka_weekly_data# A tibble: 23,882 × 6
year week start.date end.date district cases
<dbl> <dbl> <date> <date> <chr> <dbl>
1 2006 52 2006-12-23 2006-12-29 Colombo 71
2 2006 52 2006-12-23 2006-12-29 Gampaha 12
3 2006 52 2006-12-23 2006-12-29 Kalutara 12
4 2006 52 2006-12-23 2006-12-29 Kandy 20
5 2006 52 2006-12-23 2006-12-29 Matale 4
6 2006 52 2006-12-23 2006-12-29 NuwaraEliya 1
7 2006 52 2006-12-23 2006-12-29 Galle 1
8 2006 52 2006-12-23 2006-12-29 Hambanthota 1
9 2006 52 2006-12-23 2006-12-29 Matara 11
10 2006 52 2006-12-23 2006-12-29 Jaffna 0
# ℹ 23,872 more rows